
Let’s be honest – most students don’t wake up excited about velocity calculations or sediment sampling. But Paper 4 isn’t about loving riverbanks or measuring beach slopes; it’s about proving you can think like a geographer, even with soggy socks and a slightly dodgy clinometer.
This blog helps you move from just describing to analysing and evaluating — exactly what you need to keep moving those grades a little higher. Here’s how to tackle it.
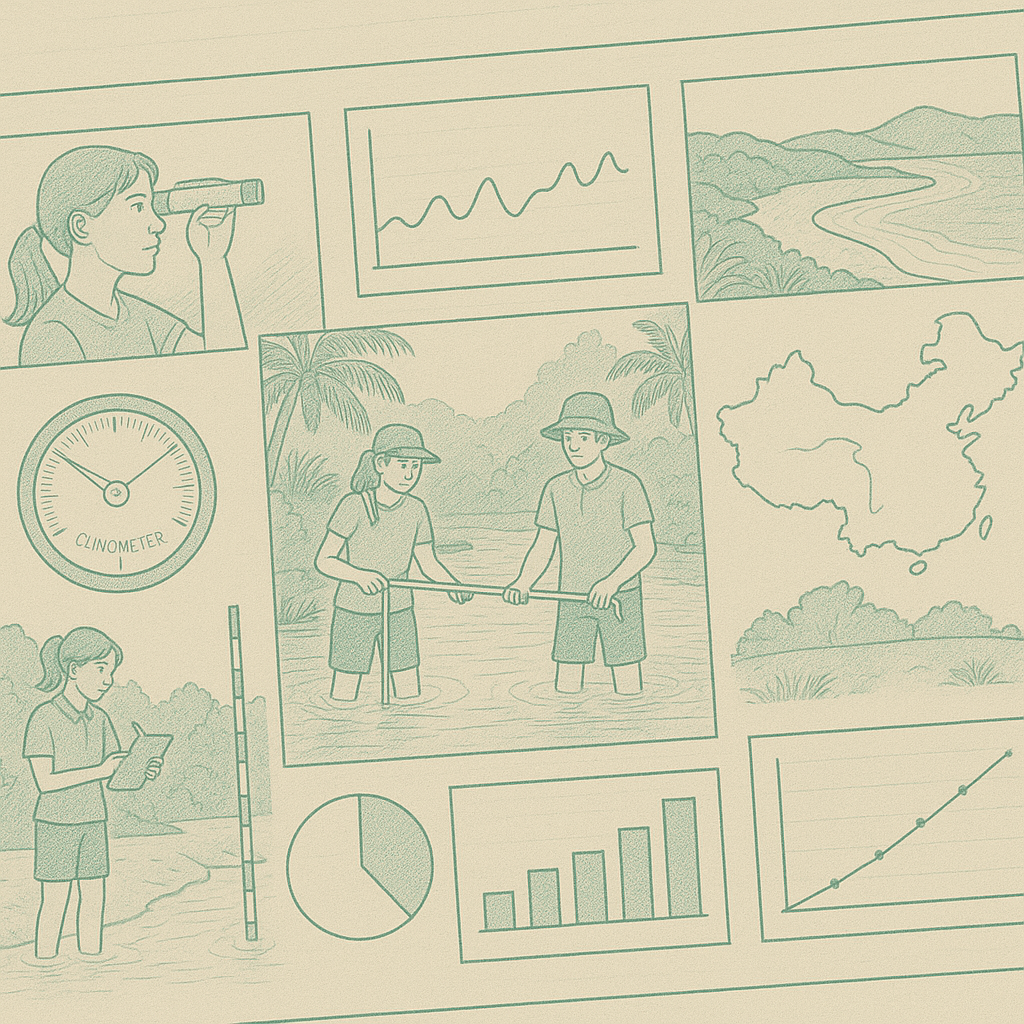
🌊 Rivers Fieldwork: Going With the Flow
Common Questions:
- How does velocity change along a river’s course?
- How do cross-sectional shapes vary from source to mouth?
- What’s the link between load size and discharge?
Step-by-Step:
- Hypothesis Example:
“River velocity increases downstream due to less friction and more efficient channel shape.” - Data Collection:
- Use a float or flowmeter at 3 equal points across the channel (left, middle, right). Measuring the Flow of a Stream | The Float Method and Measuring River Velocity (with a basic flow meter)
- Measure width, depth, and bedload size (10 samples per site). Bedload Sampling & Analysis
- Record data from at least 3 sites (upper, middle, lower course). How to measure a river cross section and Discharge
- Use a float or flowmeter at 3 equal points across the channel (left, middle, right). Measuring the Flow of a Stream | The Float Method and Measuring River Velocity (with a basic flow meter)
- Data Presentation:
- Line graph for velocity change.
- Bar graph for bedload size.
- Annotated field sketches for cross-section.Field sketches in Geography and How to complete a field sketch
- Line graph for velocity change.
- Analysis:
Look for trends, such as faster flow in the middle course. Link back to theory — e.g. wider channels and reduced friction. - Evaluation:
- Were there obstacles in the river?
- Did floats get stuck?
- Was data collected at the same time of day for all sites?
- Were there obstacles in the river?
💡 Top Tip for A:* Use terms like “hydraulic radius” and “wetted perimeter” when discussing efficiency and velocity.
🏖️ Coasts Fieldwork: Reading the Beach
Common Questions:
- How does beach gradient change along the coast?
- What is the effectiveness of different coastal management strategies?
Step-by-Step:
- Hypothesis Example:
“The beach gradient becomes steeper where groynes are present.” - Data Collection:
- Use a clinometer and tape measure to measure slope every 5 metres from sea to backshore.
Coastal Fieldwork Equipment – Internet Geography and Coastal Fieldwork Techniques – Internet Geography
How to Measure Tree Height using a Clinometer
- Record sediment size and shape at each interval. Bedload Sampling & Analysis
- Take notes on types of management (e.g., sea walls, gabions).Coastal Management Strategies – Internet Geography
General but detailed methods: Method for Coastal Management
Highly detailed but a LONG read: Coastal Management Strategies | GCSE Geography Revision Notes
- Data Presentation:
- Beach profiles as line graphs.
- Pie charts of sediment roundness.
- Annotated photos of coastal defences.
- Beach profiles as line graphs.
- Analysis:
- Compare gradients between managed vs unmanaged areas.
- Link sediment shape to energy of the environment.
- Compare gradients between managed vs unmanaged areas.
- Evaluation:
- Was your clinometer level each time?
- Was the tide going in or out? That affects gradient readings!
- Was your clinometer level each time?
💡 Top Tip for A:* Mention longshore drift and explain how it interacts with groynes when analysing sediment build-up. How to measure Longshore Drift (with a small explanation of what longshore drift is and how it works: Longshore Drift Explained: Understand Coastal Processes | GCSE Geography Help | HRB Education)
Highly detailed but a LONG read: Fieldwork | Geography
🧠 General Fieldwork Tips for Physical Geography
Fairness:
- Repeat measurements at least 3 times.
- Collect data at the same tidal state or time of day.
- Ensure all sites are measured under similar weather conditions.
Safety:
- Wear bright clothing near water.
- Work in pairs or small groups.
- Avoid steep or unstable riverbanks and check the tide timetable before coastal fieldwork.
Don’t Forget:
- Take photos to annotate later.
- Always relate results back to geographical theory — not just what, but why.
For more general support, take a look at Top Tips for IGCSE Geography Paper 4: Alternative to Coursework (0460)